There are several factors that contribute to the increased presence of diseases in soybean fields. It’s interesting to know that they were previously not known. Or they presented no economic threat to the growth of a soybean crop. The increased surface residue of reduced tillage cropping systems provides over-wintering protection to a greater percentage of the disease diapause structures.

The change in pesticide usage allows more host plants to survive for a longer period of time after the soybean crop emerges. There are over 400 host plants that will support Sclerotinia, for example. You can see some evidence points to actual genetic susceptibility in newer varieties, especially GMO varieties.
Earlier planting dates at lower soil temperatures also contribute by placing the soybean plant in a soil environment that supports cool-season diseases. This tactic would help the disease to die off by the time soil temperature reaches 60 degrees F.
Management Guidelines
The two primary diseases are Sclerotinia sclerotia (white mold, stem mold) and Fusarium Solani (Soybean Sudden Death Syndrome). Both of these diseases are soil-borne, airborne, waterborne, and in the case of Sclerotinia – can be seed-borne also.
At the end of the disease life cycle, if left untreated, the plant appearance and effect on the plant are very much the same from either of these diseases.
Unfortunately, the disease actually occurs much earlier in the season than when the symptoms are visible. So a scouting program to “catch it early” will have little chance of success. Once you see evidence of the disease the infection has been at work for up to 6 weeks and the damage is irreversible.
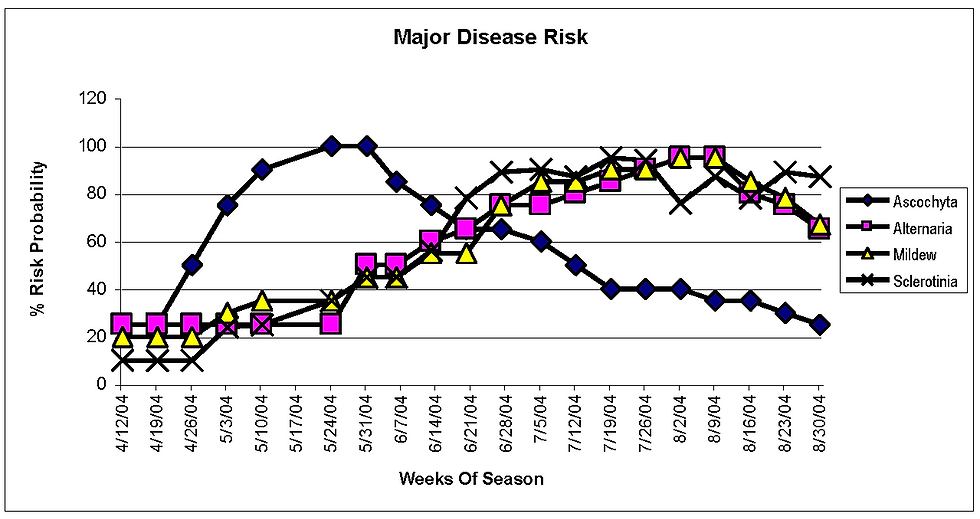
Major Disease Risk
The most successful programs require treating the seed with a good fungicide before planting and then following the split application of another systemic fungicide, making two applications of 50% rates. There is also good evidence that wider row spacing (30” vs. 15”) allows more natural sunlight penetration because the sunshine is nature’s fungicide.
The timing of these applications is critical and difficult to judge without some help from modern technology. In the graphs included there are depictions of the seasonal risk levels of several diseases. You can see what happens when you have a cool-weather disease and a warm-season disease. As in the case with SDS and Sclerotinia, you have two levels of a threat at different times of the season.
Additionally, the conditions required for these diseases to germinate and attack the soybean plant are finely balanced between temperature, soil moisture, and rainfall/rain splash and crop stage.
Timing Decision
There is one of the most effective ways to get help with this timing decision. Firstly, put instrumentation in the field. Secondly, collect the data and process it into a computer-generated model that uses a neural net. It will help to determine if all the criteria have been met to germinate the disease.
Moreover, it will dictate a treatment start point. In most cases, these points will be quite definite and leave little doubt that it is time to spray. The hard part is that there will be absolutely no visible symptoms when the spraying is done, but that is the only way to keep ahead of the disease.
As demonstrated in the Major Disease Risk chart below, the criteria for every disease are slightly different. Computer models use long-term history compared to current data to determine the reality of the situation and accumulate points over a time period so that False Positives are kept to a minimum (93% accurate).

Chart Details
The data represented in the 30-year chart below shows in the average year that all the criteria are satisfied and the disease Sclerotinia germinates. It also shows how long that germination window lasts. GI is a Growth Index that combines temperature and humidity to estimate the probability of growth of the disease organism. TI is just a Temperature Index that is tracked also for negative points as some diseases do not survive high temperatures. MI is a Moisture Index that tracks the available moisture. It also determines if the moisture is adequate for the disease to germinate and grow.
The lower graph is an actual output graph from a disease model. It shows a “build-up” scenario leading to a 100% probability of the disease germination. It also shows that the criteria were satisfied for a sufficient length of time, that it is 100% probable that a germination event did take place, and that by midnight of June 19 it was time to spray. And the model starts over tracking the next accumulation of “points” which will then indicate the speed at which the disease is infecting plants.
Data Collection
In many areas, a group of growers will purchase weather data collection equipment. They place it on some representative fields in their area. You can collect data by wireless communication and record it on a PC, which has a connection to the wireless antenna.
The software for reading and interpreting data and also generating disease model graphs run on that PC. So all the growers share the output either by email, fax, or cell phone. Usually, they find that they recover several times the cost of the equipment in the first year. You can do modeling from other weather data sources also if you are capable of building your own models.
Conclusion
Disease modeling works on many types of crops in most areas. Potatoes growers see an absolute return on investment within one year of utilizing a disease modeling system. With today’s technology, this should be a regular part of your on-farm practices.


Comments